


官方公众号企业安全新浪微博

FreeBuf.COM网络安全行业门户,每日发布专业的安全资讯、技术剖析。

FreeBuf+小程序

- 关注
centos + suricata性能测试及优化
一、概述
项目要求部署一套支持全流量解析并快速检索的系统,计划是suricata解析实时流量并将解析后的json日志存储到 ELK中。
由于项目要求,需要部署在云服务器中,在主机配置不是特别高的情况下,suricata的默认配置丢包率很高。
在此进行suricata的配置文件的测试和优化。
机器配置:
系统:vmware虚拟机 - CentOS 7.9
配置:vmware虚拟机 - 4核 8G
网卡:vmware虚拟机 - 千兆网卡
pcap:http_weakpass_brust.pcap 大小约 50MB
二、suricata安装
suricata安装链接:
流量分析工具(二):centos7 + suricata + redis + ELK
启用对性能分析的支持,编译的时候增加参数 --enable-profiling
# 安装步骤
wget https://www.openinfosecfoundation.org/download/suricata-6.0.12.tar.gz
tar zxvf suricata-6.0.12.tar.gz
cd suricata-6.0.12/
./configure \
--prefix=/usr \
--sysconfdir=/etc \
--localstatedir=/var \
--enable-profiling #启用性能分析

make
make install
make install-conf
/bin/cp -d libhtp/htp/.libs/libhtp.so* /lib64/
ldconfig
cd ..
rm suricata-6.0.12/ -rf

suricata -V
三、测试环境配置
安装发包、测试及监控工具
# 主机配置 CentOS 7 + 4核8G

yum install zip vim gcc make unzip iftop atop htop glances tcpreplay tcpdump lrzsz -y
tcpreplay 的使用:
tcpreplay 是一款发包工具,支持读取pcap文件进行重放,可以自定义修改打包速度以及发包的源目IP等。
tcpreplay 的使用参考: https://www.renrendoc.com/paper/214963447.html以不同的速度回放示例
# 最大速回放
tcpreplay --topspeed -i ens33 sample.pcap

# 以100Mbps 速度回放(给网卡打满100M带宽)
tcpreplay --mbps=100 -i ens33 sample.pcap

# 以原速度的 7.3 倍速率回放
tcpreplay --multiplier=7.3 -i ens33 sample.pcap

# 以每秒回放25个包的速率回放
tcpreplay --pps=25 -i ens33 sample.pcap

# 循环发包
--loop=0
机器性能配置
# https://www.intel.cn/content/www/cn/zh/docs/programmable/683633/1-2-1/memlock-limit.html
#修改系统配置
cat >>
/etc/security/limits.conf <<EOF
* soft nofile  655360
* hard nofile  655360
* soft nproc  655360
* hard nproc  655360
* hard memlock unlimited
* soft memlock unlimited
EOF


cat >> /etc/sysctl.conf <<EOF
vm.max_map_count=655360
fs.file-max=655360
net.core.somaxconn = 32768
vm.overcommit_memory = 1
net.ipv4.ip_conntrack_max = 655360
net.ipv4.ip_local_port_range = 10000 65000
net.ipv4.tcp_syncookies = 1
net.ipv4.tcp_tw_reuse = 1
net.ipv4.tcp_tw_recycle = 1
net.ipv4.tcp_fin_timeout = 30
net.ipv4.tcp_keepalive_time = 1200
net.ipv4.tcp_max_tw_buckets = 6000
net.ipv4.tcp_max_syn_backlog = 65536
net.core.netdev_max_backlog = 32768
net.core.wmem_default = 8388608
net.core.rmem_default = 8388608
net.core.rmem_max = 16777216
net.core.wmem_max = 16777216
net.ipv4.tcp_timestsmps = 0
net.ipv4.tcp_synack_retries = 2
net.ipv4.tcp_syn_retries = 2
net.ipv4.tcp_tw_reuse = 1
net.ipv4.tcp_fin_timeout = 30
net.ipv4.tcp_max_orphans= 3276800
net.ipv4.tcp_fin_timeout= 30
EOF
sysctl -p

ifconfig ens33 mtu 9000


# 机器配置
ethtool -K $IFACE_NAME  tso off lro off gro off
ethtool -K $IFACE_NAME  rx off
ethtool -K $IFACE_NAME  tx off
ethtool -K $IFACE_NAME  sg off
ethtool -K $IFACE_NAME  gso off
ethtool -K $IFACE_NAME  gro off
ethtool -K $IFACE_NAME  lro off
ethtool -K $IFACE_NAME  rxvlan off
ethtool -K $IFACE_NAME  txvlan off
ethtool -K $IFACE_NAME  ntuple off
ethtool -K $IFACE_NAME  rxhash off
ethtool -K $IFACE_NAME  rx off  tx off


# 其他参考:https://paper.seebug.org/1054/
编写一条suricata规则,用于测试
[root@localhost suricata]# vim http.rules
alert http any any -> any any (msg:"HTTP protocol"; http.protocol; content:"HTTP/"; sid:3;)
suricata默认配置文件,追加规则
[root@localhost suricata]# vim /etc/suricata/suricata.yaml +1930
rule-files:
  - /etc/suricata/http.rules
启动suricata,运行发包
# tcpreplay 以300M带宽发包
tcpreplay --mbps=300 --loop=0  -i ens33 http_weakpass_brust.pcap

# 启动 suricata,运行个5分钟左右
[root@localhost ~]# suricata -i ens33

# 监控主机性能情况
[root@localhost srv]# glances
[root@localhost srv]# htop

# 查看网卡的流量情况
[root@localhost srv]# iftop
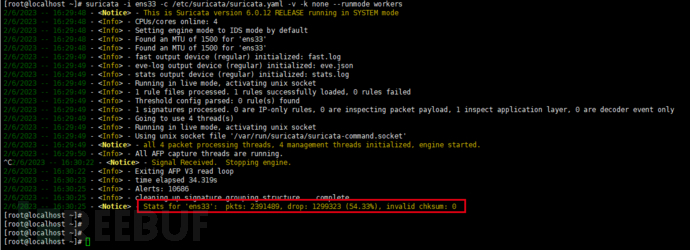
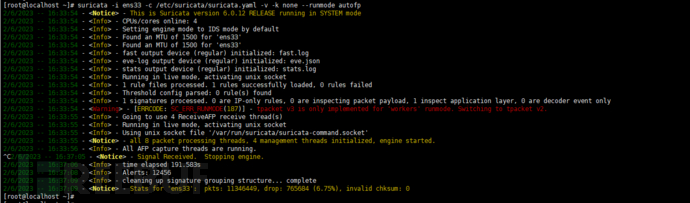
Ctrl+C 结束运行suricata,末尾会输出丢包率的统计,如 丢包率 58.70%,意味着有超过一半的流量是丢包的,可以通过suricata自带的流量包存储功能分析,详情查看 /etc/suricata/suricata.yaml 中的 - pcap-log: 参数,通过分析保存的pcap文件大小和发包出去的单个pcap大小即可。
[root@localhost ~]# suricata -i ens33 -c /etc/suricata/suricata.yaml -v -k none --runmode workers
2/6/2023 -- 14:18:35 - <Notice> - This is Suricata version 6.0.12 RELEASE running in SYSTEM mode
2/6/2023 -- 14:18:37 - <Notice> - all 4 packet processing threads, 4 management threads initialized, engine started.
^C2/6/2023 -- 14:19:04 - <Notice> - Signal Received.  Stopping engine.
2/6/2023 -- 14:19:12 - <Notice> - Stats for 'ens33':  pkts: 2019767, drop: 1185613 (58.70%), invalid chksum: 0
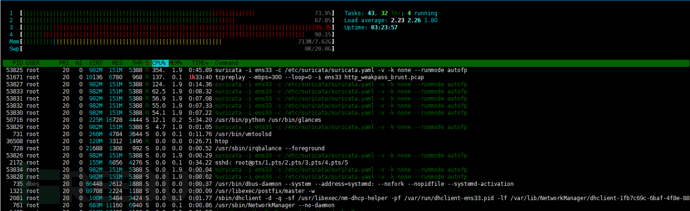
8. htop监控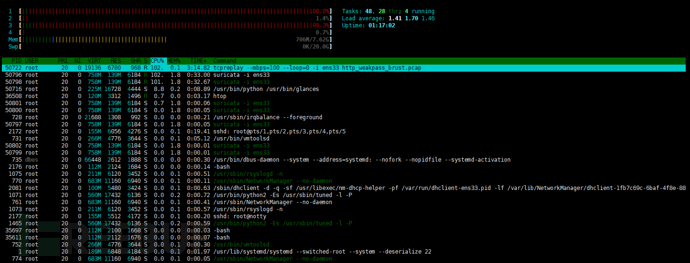
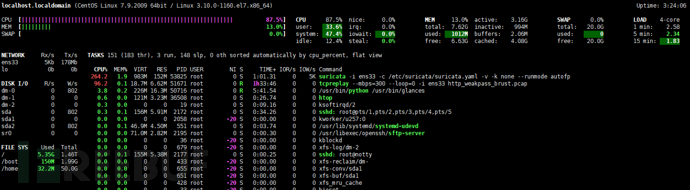
9. glance监控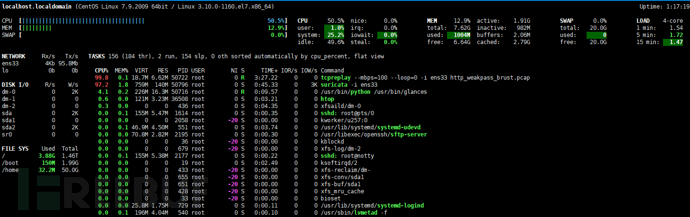
10. iftop 带宽情况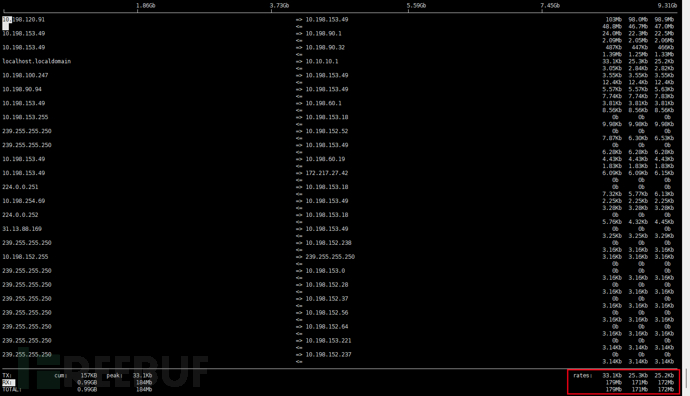
11. 日志输出文件中查看
[root@localhost suricata]# ls -l /var/log/suricata/
total 2152000
drwxr-xr-x. 2 root root          6 Jun  2 13:34 certs
-rw-r--r--. 1 root root 1581569606 Jun  2 16:30 eve.json
-rw-r--r--. 1 root root   77673240 Jun  2 16:30 fast.log
drwxr-xr-x. 2 root root          6 Jun  2 13:34 files
-rw-r--r--. 1 root root      59728 Jun  2 16:30 keyword_perf.log
-rw-r--r--. 1 root root     516099 Jun  2 16:30 packet_stats.log
-rw-r--r--. 1 root root      27380 Jun  2 16:30 prefilter_perf.log
-rw-r--r--. 1 root root      39640 Jun  2 16:30 rule_group_perf.log
-rw-r--r--. 1 root root      71414 Jun  2 16:30 rule_perf.log
-rw-r--r--. 1 root root    3447704 Jun  2 16:30 stats.log
-rw-r--r--. 1 root root      96176 Jun  2 16:30 suricata.log
[root@localhost suricata]# cat stats.log
四、测试优化
(1) 运行模式
过程分析
根据官网说明,suricata 的高性能模式配置,可选 autofp 和 workers,workers模式建议在大流量背景下使用。
保持 tcpreplay 发包进程持续运行,只需修改 suricata 的启动命令即可。woerks模式下运行5分钟
[root@localhost ~]# suricata -i ens33 -c /etc/suricata/suricata.yaml -v -k none --runmode workers
丢包率:50.03%
2/6/2023 -- 15:10:58 - <Notice> - Stats for 'ens33': pkts: 16192673, drop: 8101622 (50.03%), invalid chksum: 0
autofp 模式下运行5分钟
[root@localhost ~]# suricata -i ens33 -c /etc/suricata/suricata.yaml -v -k none --runmode autofp
丢包率: 5.98%
2/6/2023 -- 15:16:06 - <Notice> - Stats for 'ens33': pkts: 18083834, drop: 1082036 (5.98%), invalid chksum: 0
分析结果
在4核8G,100M带宽流量打满的情况下,运行模式 autofp 比 workers 拥有更好的表现,可以极大地降低丢包率。
(2) 高丢包率的优化
参考链接:https://forum.suricata.io/t/suricata-6-0-1-high-packet-loss/982/1
自定义修改 suricata 配置文件
vim /etc/suricata/suricata.yaml +588
af-packet:
  - interface: ens33
    threads: auto
    cluster-id: 99
    cluster-type: cluster_flow
    mmap-locked: yes
    tpacket-v3: yes


vim /etc/suricata/suricata.yaml +1154
vlan:
  use-for-tracking: false

vim /etc/suricata/suricata.yaml +1494
mpm-algo: ac-ks
(3) suricata 10GBit环境 配置优化(仅参考)
参考连接
Suricata 万兆环境部署优化:https://paper.seebug.org/1054/
配置
# suricata 能够同时处理多少个数据包
max-pending-packets: 8192
runmode: workers
defrag:
    memcap: 20gb
    imeout: 3
flow:
    memcap: 8gb
    hash-size: 50000
    prealloc: 50000
    emergency-recovery: 30

# 流超时信息设置,将原来的数值调小
flow-timeouts:
    default:
        new: 5
        established: 60
        closed: 3
        bypassed: 30
        emergency-new: 10
        emergency-established: 30
        emergency-closed: 0
        emergency-bypassed: 50
              tcp:
        new: 5
        established: 60
        closed: 1
        bypassed: 30
        emergency-new: 3
        emergency-established: 30
        emergency-closed: 0
        emergency-bypassed: 15
    udp:
        new: 5
        established: 60
        bypassed: 30
        emergency-new: 3
        emergency-established: 30
        emergency-bypassed: 15
    icmp:
        new: 5
        established: 30
        bypassed: 30
        emergency-new: 10
        emergency-established: 15
        emergency-bypassed: 10

#流设置,小了影响性能
stream:
    memcap: 10gb
    checksum-validation: no
    inline: no
    bypass: yes
    prealloc-sessions: 100000
    midstream: true
    drop-invalid: yes
    reassembly:
        memcap: 20gb
        depth: 128kb
        toserver-chunk-size: 10240
        toclient-chunk-size: 10240
        randomize-chunk-size: no
        raw: yes
        segment-prealloc: 20000
        check-overlap-different-data: true

# 数值越大性能越好,占用资源也越高,对性能这块影响较高。
detect:
    profile: high
    custom-values:
        toclient-groups: 100000
        toserver-groups: 100000
    sgh-mpm-context: full
    inspection-recursion-limit: 1000000

# 这里将正则表达式引擎pcre替换为intel的hyperscan(需要重新编译)
#hyperscan与pcre性能对比 https://blog.csdn.net/vevenlcf/article/details/77883178
mpm-algo: hs
spm-algo: hs

# cpu亲和性设置
cpu-affinity:
    - management-cpu-set:
        cpu: [ 1,0]
        prio:
          default: "low"
    - worker-cpu-set:
        cpu: [ '0-37']
        mode: "exclusive"
        prio:
          high: [ '2-38' ]
          default: "high"
pfring:
    - interface: eth0
        threads: 38
        cluster-id: 99
        cluster-type: cluster_flow
        checksum-checks: no
五、结果分析
根据以上调试,虚拟机低配环境下,运行模式使用 autofp 比 workers 的丢包率要低很多,一般情况下,丢包率在10% 以内都是可以允许的, 当然了,丢包率越低越好,主机的硬件配置越高越好,更高的硬件配置会来带更好的表现效果。
300M带宽打满的情况下,4和8G的虚拟主机,丢包率约6.75%
[root@localhost ~]# suricata -i ens33 -c /etc/suricata/suricata.yaml -v -k none --runmode autofp
...
...
...
2/6/2023 -- 16:37:09 - <Notice> - Stats for 'ens33':  pkts: 11346449, drop: 765684 (6.75%), invalid chksum: 0
六、我的完整的配置文件
%YAML 1.1
---
# Suricata configuration file. In addition to the comments describing all
# options in this file, full documentation can be found at:
# https://suricata.readthedocs.io/en/latest/configuration/suricata-yaml.html
#
# This configuration file generated by:
# Suricata 6.0.10
##
## Step 1: Inform Suricata about your network
##
vars:
# more specific is better for alert accuracy and performance
address-groups:
HOME_NET: "[192.168.0.0/16,10.0.0.0/8,172.16.0.0/12, ![$SEC_SCANNERS]]"
#HOME_NET: "[192.168.0.0/16]"
#HOME_NET: "[10.0.0.0/8]"
#HOME_NET: "[172.16.0.0/12]"
#HOME_NET: "any"
EXTERNAL_NET: "![$SEC_SCANNERS, $HOME_NET]"
#EXTERNAL_NET: "any"
HTTP_SERVERS: "$HOME_NET"
SMTP_SERVERS: "[10.20.198.154, 10.20.198.153, 10.20.95.0/24, 10.20.198.20]"
SQL_SERVERS: "[10.20.135.0/24, 10.2.135.0/24]"
DNS_SERVERS: "[10.2.95.51, 10.2.95.55, 10.2.95.57, 10.118.96.29, 10.126.54.101, 10.126.54.102, 10.2.198.128, 10.2.198.130, 10.2.198.132, 10.2.198.134, 10.2.198.136, 10.2.198.138, 10.20.198.130, 10.20.198.132, 10.20.198.134, 10.20.198.136, 10.20.198.138]"
TELNET_SERVERS: "$HOME_NET"
AIM_SERVERS: "$EXTERNAL_NET"
DC_SERVERS: "$HOME_NET"
DNP3_SERVER: "$HOME_NET"
DNP3_CLIENT: "$HOME_NET"
MODBUS_CLIENT: "$HOME_NET"
MODBUS_SERVER: "$HOME_NET"
ENIP_CLIENT: "$HOME_NET"
ENIP_SERVER: "$HOME_NET"
## added variables
AWS: "[52.216.0.0/15, 54.231.0.0/17]"
SEC_SCANNERS: "[10.20.142.211, 10.20.142.212, 10.2.142.211, 10.2.142.212]"
F5_SERVERS: "[10.20.199.246, 10.20.199.247, 10.2.199.246, 10.2.199.247]"
SITE_SERVERS_BACK: "[10.20.142.0/23, 10.20.144.0/22, 10.2.142.0/23, 10.2.144.0/22]"
SITE_SERVERS_FRONT: "[10.20.140.0/23, 10.20.134.0/24]"
OPSDC: "[10.20.94.4, 10.20.94.5, 10.20.94.104, 10.20.94.105]"
AFFINITY: "[10.20.141.0/24]"
#TENABLE_EXTERNAL: "[]"
port-groups:
HTTP_PORTS: "[80, 8080]"
SMTP_PORTS: 25
SHELLCODE_PORTS: "!80"
ORACLE_PORTS: 1521
SSH_PORTS: 22
DNP3_PORTS: 20000
MODBUS_PORTS: 502
FILE_DATA_PORTS: "[$HTTP_PORTS,110,143]"
FTP_PORTS: 21
GENEVE_PORTS: 6081
VXLAN_PORTS: 4789
TEREDO_PORTS: 3544
SQL_PORTS: 1433
##
## Step 2: Select outputs to enable
##
# The default logging directory. Any log or output file will be
# placed here if it's not specified with a full path name. This can be
# overridden with the -l command line parameter.
default-log-dir: /var/log/suricata
# Global stats configuration
stats:
enabled: yes
# The interval field (in seconds) controls the interval at
# which stats are updated in the log.
interval: 8
# Add decode events to stats.
#decoder-events: true
# Decoder event prefix in stats. Has been 'decoder' before, but that leads
# to missing events in the eve.stats records. See issue #2225.
#decoder-events-prefix: "decoder.event"
# Add stream events as stats.
#stream-events: false
# Configure the type of alert (and other) logging you would like.
outputs:
# a line based alerts log similar to Snort's fast.log
- fast:
enabled: no
filename: fast.log
append: yes
#filetype: regular # 'regular', 'unix_stream' or 'unix_dgram'
# high packet lossSuricata
# https://forum.suricata.io/t/suricata-6-0-1-high-packet-loss/982/1
# Extensible Event Format (nicknamed EVE) event log in JSON format
# https://www.osgeo.cn/suricata/output/eve/eve-json-output.html?highlight=eve%20nsm%20json
- eve-log:
enabled: yes
filetype: redis #regular|syslog|unix_dgram|unix_stream|redis
# filename: /data/suricata/protocol/alert-%Y-%m-%d-%H:%M:%S.json
# filemode: 644
# json:
# # Sort object keys in the same order as they were inserted
# preserve-order: yes
# # Make the output more compact
# compact: yes
# # Escape all unicode characters outside the ASCII range
# ensure-ascii: yes
# # Escape the '/' characters in string with '\/'
# escape-slash: yes
#
# # The example above rotates eve-log each 30 seconds.
# # This could be replaced with 30m to rotate every 30 minutes, 30h to rotate every 30 hours,
# # 30d to rotate every 30 days, or 30w to rotate every 30 weeks.
# # rotate the log file each 60 minutes.
# rotate-interval: 60m # 60 minutes
#
# # Enable for multi-threaded eve.json output; output files are amended with
# # with an identifier, e.g., eve.9.json
# threaded: false
# identity: "suricata"
# facility: local5
#prefix: "@cee: " # prefix to prepend to each log entry
# the following are valid when type: syslog above
level: Alert
## possible levels: Emergency, Alert, Critical, Error, Warning, Notice, Info, Debug
ethernet: yes # log ethernet header in events when available
redis:
server: 127.0.0.1
port: 6379
async: true ## if redis replies are read asynchronously
mode: channel
## possible values: list|lpush (default), rpush, channel|publish
## lpush and rpush are using a Redis list. "list" is an alias for lpush
## publish is using a Redis channel. "channel" is an alias for publish
key: suricata_alert
## key or channel to use (default to suricata)
# Redis pipelining set up. This will enable to only do a query every
# 'batch-size' events. This should lower the latency induced by network
# connection at the cost of some memory. There is no flushing implemented
# so this setting should be reserved to high traffic Suricata deployments.
pipelining:
enabled: yes ## set enable to yes to enable query pipelining
batch-size: 10 ## number of entries to keep in buffer
# Include top level metadata. Default yes.
metadata: yes
# include the name of the input pcap file in pcap file processing mode
pcap-file: true
# Community Flow ID
# Adds a 'community_id' field to EVE records. These are meant to give
# records a predictable flow ID that can be used to match records to
# output of other tools such as Zeek (Bro).
#
# Takes a 'seed' that needs to be same across sensors and tools
# to make the id less predictable.
# enable/disable the community id feature.
community-id: true
# Seed value for the ID output. Valid values are 0-65535.
# community-id-seed: 0
# HTTP X-Forwarded-For support by adding an extra field or overwriting
# the source or destination IP address (depending on flow direction)
# with the one reported in the X-Forwarded-For HTTP header. This is
# helpful when reviewing alerts for traffic that is being reverse
# or forward proxied.
xff:
enabled: yes
# Two operation modes are available: "extra-data" and "overwrite".
mode: extra-data
# Two proxy deployments are supported: "reverse" and "forward". In
# a "reverse" deployment the IP address used is the last one, in a
# "forward" deployment the first IP address is used.
deployment: reverse
# Header name where the actual IP address will be reported. If more
# than one IP address is present, the last IP address will be the
# one taken into consideration.
header: X-Forwarded-For
types:
- alert:
payload: no # enable dumping payload in Base64
payload-buffer-size: 1000kb # max size of payload buffer to output in eve-log
# payload-printable: yes # enable dumping payload in printable (lossy) format
packet: no # enable dumping of packet (without stream segments)
# metadata: yes # enable inclusion of app layer metadata with alert. Default yes
http-body: yes # Requires metadata; enable dumping of HTTP body in Base64
http-body-printable: yes # Requires metadata; enable dumping of HTTP body in printable format
# Enable the logging of tagged packets for rules using the
# "tag" keyword.
tagged-packets: yes
metadata:
# Include the decoded application layer (ie. http, dns)
app-layer: true
# Log the the current state of the flow record.
flow: false
rule:
# Log the metadata field from the rule in a structured format.
metadata: true
# Log the raw rule text.
raw: false
# HTTP X-Forwarded-For support by adding an extra field or overwriting
# the source or destination IP address (depending on flow direction)
# with the one reported in the X-Forwarded-For HTTP header. This is
# helpful when reviewing alerts for traffic that is being reverse
# or forward proxied.
xff:
enabled: yes
# Two operation modes are available, "extra-data" and "overwrite".
mode: extra-data
# Two proxy deployments are supported, "reverse" and "forward". In
# a "reverse" deployment the IP address used is the last one, in a
# "forward" deployment the first IP address is used.
deployment: reverse
# Header name where the actual IP address will be reported, if more
# than one IP address is present, the last IP address will be the
# one taken into consideration.
header: X-Forwarded-For
# Extensible Event Format (nicknamed EVE) event log in JSON format
- eve-log:
enabled: yes
filetype: redis #regular|syslog|unix_dgram|unix_stream|redis
# filename: /data/suricata/protocol/protocol-%Y-%m-%d-%H:%M:%S.json
# filemode: 644
# json:
# # Sort object keys in the same order as they were inserted
# preserve-order: yes
# # Make the output more compact
# compact: yes
# # Escape all unicode characters outside the ASCII range
# ensure-ascii: yes
# # Escape the '/' characters in string with '\/'
# escape-slash: yes
#
# # The example above rotates eve-log each 30 seconds.
# # This could be replaced with 30m to rotate every 30 minutes, 30h to rotate every 30 hours,
# # 30d to rotate every 30 days, or 30w to rotate every 30 weeks.
# # rotate the log file each 60 minutes.
# rotate-interval: 60m # 60 minutes
#
# # Enable for multi-threaded eve.json output; output files are amended with
# # with an identifier, e.g., eve.9.json
# threaded: false
# identity: "suricata"
# facility: local5
#prefix: "@cee: " # prefix to prepend to each log entry
# the following are valid when type: syslog above
level: Alert
## possible levels: Emergency, Alert, Critical, Error, Warning, Notice, Info, Debug
ethernet: yes # log ethernet header in events when available
redis:
server: 127.0.0.1
port: 6379
async: true ## if redis replies are read asynchronously
mode: channel
## possible values: list|lpush (default), rpush, channel|publish
## lpush and rpush are using a Redis list. "list" is an alias for lpush
## publish is using a Redis channel. "channel" is an alias for publish
key: suricata_protocol
## key or channel to use (default to suricata)
# Redis pipelining set up. This will enable to only do a query every
# 'batch-size' events. This should lower the latency induced by network
# connection at the cost of some memory. There is no flushing implemented
# so this setting should be reserved to high traffic Suricata deployments.
pipelining:
enabled: yes ## set enable to yes to enable query pipelining
batch-size: 10 ## number of entries to keep in buffer
# Include top level metadata. Default yes.
metadata: yes
# include the name of the input pcap file in pcap file processing mode
pcap-file: true
# Community Flow ID
# Adds a 'community_id' field to EVE records. These are meant to give
# records a predictable flow ID that can be used to match records to
# output of other tools such as Zeek (Bro).
#
# Takes a 'seed' that needs to be same across sensors and tools
# to make the id less predictable.
# enable/disable the community id feature.
community-id: true
# Seed value for the ID output. Valid values are 0-65535.
# community-id-seed: 0
# HTTP X-Forwarded-For support by adding an extra field or overwriting
# the source or destination IP address (depending on flow direction)
# with the one reported in the X-Forwarded-For HTTP header. This is
# helpful when reviewing alerts for traffic that is being reverse
# or forward proxied.
xff:
enabled: yes
# Two operation modes are available: "extra-data" and "overwrite".
mode: extra-data
# Two proxy deployments are supported: "reverse" and "forward". In
# a "reverse" deployment the IP address used is the last one, in a
# "forward" deployment the first IP address is used.
deployment: reverse
# Header name where the actual IP address will be reported. If more
# than one IP address is present, the last IP address will be the
# one taken into consideration.
header: X-Forwarded-For
types:
- anomaly:
# Anomaly log records describe unexpected conditions such
# as truncated packets, packets with invalid IP/UDP/TCP
# length values, and other events that render the packet
# invalid for further processing or describe unexpected
# behavior on an established stream. Networks which
# experience high occurrences of anomalies may experience
# packet processing degradation.
#
# Anomalies are reported for the following:
# 1. Decode: Values and conditions that are detected while
# decoding individual packets. This includes invalid or
# unexpected values for low-level protocol lengths as well
# as stream related events (TCP 3-way handshake issues,
# unexpected sequence number, etc).
# 2. Stream: This includes stream related events (TCP
# 3-way handshake issues, unexpected sequence number,
# etc).
# 3. Application layer: These denote application layer
# specific conditions that are unexpected, invalid or are
# unexpected given the application monitoring state.
#
# By default, anomaly logging is enabled. When anomaly
# logging is enabled, applayer anomaly reporting is
# also enabled.
enabled: no
#
# Choose one or more types of anomaly logging and whether to enable
# logging of the packet header for packet anomalies.
#types:
# decode: yes
# stream: yes
# applayer: yes
#packethdr: yes
- http:
extended: yes # enable this for extended logging information
# custom allows additional HTTP fields to be included in eve-log.
# the example below adds three additional fields when uncommented
# custom: [accept, accept-charset, accept-encodin, accept-languag, accept-datetim, authorization, cache-control, cookie, from, max-forwards, origin, pragma, proxy-auth, range, te, via, x-requeste, dnt, x-forwarde, x-auth, x-flash-versio, accept-range, age, allow, connection, content-en, content-la, content-length, content-lo, content-md5, content-range, content-type, date, etags, expires, last-modified, link, location, proxy-auth, referrer, refresh, retry-after, server, set-cookie, trailer, transfer-e, upgrade, vary, warning, www-authen, true-client-ip, org-src-ip, x-bluecoat-via]
# set this value to one and only one from {both, request, response}
# to dump all HTTP headers for every HTTP request and/or response
dump-all-headers: both
- dns:
# This configuration uses the new DNS logging format,
# the old configuration is still available:
# https://suricata.readthedocs.io/en/latest/output/eve/eve-json-output.html#dns-v1-format
# As of Suricata 5.0, version 2 of the eve dns output
# format is the default.
version: 2
# Enable/disable this logger. Default: enabled.
enabled: yes
# Control logging of requests and responses:
# - requests: enable logging of DNS queries
# - responses: enable logging of DNS answers
# By default both requests and responses are logged.
requests: yes
responses: yes
# Format of answer logging:
# - detailed: array item per answer
# - grouped: answers aggregated by type
formats: [detailed]
# DNS record types to log, based on the query type.
types: [a, aaaa, cname, mx, ns, ptr, txt]
# types: [a, ns, md, mf, cname, soa, mb, mg, mr, null, wks, ptr, hinfo, minfo, mx, txt, rp, afsdb, x25, isdn, rt, nsap, nsapptr, sig, key, px, gpos, aaaa, loc, nxt, srv, atma, naptr, kx, cert, a6, dname, opt, apl, ds, sshfp, ipseckey, rrsig, nsec, dnskey, dhcid, nsec3, nsec3param, tlsa, hip, cds, cdnskey, spf, tkey, tsig, maila, any, uri]
- tls:
extended: yes # enable this for extended logging information
# output TLS transaction where the session is resumed using a
# session id
session-resumption: yes
# custom controls which TLS fields that are included in eve-log
# custom: [subject, issuer, session_resumed, serial, fingerprint, sni, version, not_before, not_after, chain, ja3, ja3s]
# custom: [subject, session_resumed, sni, version, not_before, not_after, chain]
custom: [subject, session_resumed, sni, version]
- files:
force-magic: no # force logging magic on all logged files
# force logging of checksums, available hash functions are md5,
# sha1 and sha256
force-hash: [md5]
#- drop:
# alerts: yes # log alerts that caused drops
# flows: all # start or all: 'start' logs only a single drop
# # per flow direction. All logs each dropped pkt.
- smtp:
extended: yes # enable this for extended logging information
# this includes: bcc, message-id, subject, x_mailer, user-agent
# custom fields logging from the list:
# reply-to, bcc, message-id, subject, x-mailer, user-agent, received,
# x-originating-ip, in-reply-to, references, importance, priority,
# sensitivity, organization, content-md5, date
custom: [reply-to, bcc, message-id, subject, x-mailer, user-agent, received, x-originating-ip, in-reply-to, references, importance, priority, sensitivity, organization, content-md5, date]
# output md5 of fields: body, subject
# for the body you need to set app-layer.protocols.smtp.mime.body-md5
# to yes
#md5: [body, subject]
# - dnp3
- ftp
- rdp
# - nfs
- smb
- tftp
# - ikev2
- dcerpc
# - krb5
# - snmp
# - rfb
# - sip
- dhcp:
enabled: no
# # When extended mode is on, all DHCP messages are logged
# # with full detail. When extended mode is off (the
# # default), just enough information to map a MAC address
# # to an IP address is logged.
# extended: yes
- ssh
# - mqtt:
# passwords: yes # enable output of passwords
# HTTP2 logging. HTTP2 support is currently experimental and
# disabled by default. To enable, uncomment the following line
# and be sure to enable http2 in the app-layer section.
# - http2
# - stats:
# totals: yes # stats for all threads merged together
# threads: no # per thread stats
# deltas: no # include delta values
# bi-directional flows
- flow
# uni-directional flows
# - netflow
# Metadata event type. Triggered whenever a pktvar is saved
# and will include the pktvars, flowvars, flowbits and
# flowints.
# - metadata
# a line based log of HTTP requests (no alerts)
- http-log:
enabled: no
#filename: http.log
#append: yes
#extended: yes # enable this for extended logging information
#custom: yes # enable the custom logging format (defined by customformat)
#customformat: "%{%D-%H:%M:%S}t.%z %{X-Forwarded-For}i %H %m %h %u %s %B %a:%p -> %A:%P"
#filetype: regular # 'regular', 'unix_stream' or 'unix_dgram'
# a line based log of TLS handshake parameters (no alerts)
- tls-log:
enabled: no # Log TLS connections.
#filename: tls.log # File to store TLS logs.
#append: yes
#extended: yes # Log extended information like fingerprint
#custom: yes # enabled the custom logging format (defined by customformat)
#customformat: "%{%D-%H:%M:%S}t.%z %a:%p -> %A:%P %v %n %d %D"
#filetype: regular # 'regular', 'unix_stream' or 'unix_dgram'
## output TLS transaction where the session is resumed using a
## session id
#session-resumption: yes
# output module to store certificates chain to disk
- tls-store:
enabled: no
#certs-log-dir: certs # directory to store the certificates files
# Packet log... log packets in pcap format. 3 modes of operation: "normal"
# "multi" and "sguil".
#
# In normal mode a pcap file "filename" is created in the default-log-dir,
# or as specified by "dir".
#
# In multi mode, a file is created per thread. This will perform much
# better, but will create multiple files where 'normal' would create one.
# In multi mode the filename takes a few special variables:
# - %n -- thread number
# - %i -- thread id
# - %t -- timestamp (secs or secs.usecs based on 'ts-format'
# E.g. filename: pcap.%n.%t
#
# Note that it's possible to use directories, but the directories are not
# created by Suricata. E.g. filename: pcaps/%n/log.%s will log into the
# per thread directory.
#
# Also note that the limit and max-files settings are enforced per thread.
# So the size limit when using 8 threads with 1000mb files and 2000 files
# is: 8*1000*2000 ~ 16TiB.
#
# In Sguil mode "dir" indicates the base directory. In this base dir the
# pcaps are created in the directory structure Sguil expects:
#
# $sguil-base-dir/YYYY-MM-DD/$filename.<timestamp>
#
# By default all packets are logged except:
# - TCP streams beyond stream.reassembly.depth
# - encrypted streams after the key exchange
#
- pcap-log:
enabled: yes
filename: listen.pcap
# File size limit. Can be specified in kb, mb, gb. Just a number
# is parsed as bytes.
limit: 1000mb
# If set to a value, ring buffer mode is enabled. Will keep maximum of
# "max-files" of size "limit"
max-files: 100 # 100G
# Compression algorithm for pcap files. Possible values: none, lz4.
# Enabling compression is incompatible with the sguil mode. Note also
# that on Windows, enabling compression will *increase* disk I/O.
compression: none
# Further options for lz4 compression. The compression level can be set
# to a value between 0 and 16, where higher values result in higher
# compression.
#lz4-checksum: no
#lz4-level: 8
mode: sguil # normal, multi or sguil.
# Directory to place pcap files. If not provided the default log
# directory will be used. Required for "sguil" mode.
dir: /data/suricata/pcaps/
# By default the variable is set to all so all packets are logged. If the variable is set to alerts then only the flow with alerts will be logged.
# conditional: alerts
#ts-format: usec # sec or usec second format (default) is filename.sec usec is filename.sec.usec
use-stream-depth: no #If set to "yes" packets seen after reaching stream inspection depth are ignored. "no" logs all packets
honor-pass-rules: no # If set to "yes", flows in which a pass rule matched will stop being logged.
# a full alert log containing much information for signature writers
# or for investigating suspected false positives.
# it lowers the performance because of the amount of information it has to store.
- alert-debug:
enabled: no
filename: alert-debug.log
append: yes
#filetype: regular # 'regular', 'unix_stream' or 'unix_dgram'
# alert output to prelude (https://www.prelude-siem.org/) only
# available if Suricata has been compiled with --enable-prelude
- alert-prelude:
enabled: no
profile: suricata
log-packet-content: no
log-packet-header: yes
# Stats.log contains data from various counters of the Suricata engine.
- stats:
enabled: yes
filename: stats.log
append: yes # append to file (yes) or overwrite it (no)
totals: yes # stats for all threads merged together
threads: no # per thread stats
#null-values: yes # print counters that have value 0. Default: no
# a line based alerts log similar to fast.log into syslog
- syslog:
enabled: no
# reported identity to syslog. If omitted the program name (usually
# suricata) will be used.
#identity: "suricata"
facility: local5
#level: Info ## possible levels: Emergency, Alert, Critical,
## Error, Warning, Notice, Info, Debug
# Output module for storing files on disk. Files are stored in
# directory names consisting of the first 2 characters of the
# SHA256 of the file. Each file is given its SHA256 as a filename.
#
# When a duplicate file is found, the timestamps on the existing file
# are updated.
#
# Unlike the older filestore, metadata is not written by default
# as each file should already have a "fileinfo" record in the
# eve-log. If write-fileinfo is set to yes, then each file will have
# one more associated .json files that consist of the fileinfo
# record. A fileinfo file will be written for each occurrence of the
# file seen using a filename suffix to ensure uniqueness.
#
# To prune the filestore directory see the "suricatactl filestore
# prune" command which can delete files over a certain age.
- file-store:
enabled: no
version: 2
# Set the directory for the filestore. Relative pathnames
# are contained within the "default-log-dir".
dir: /data/suricata/filestore
# Write out a fileinfo record for each occurrence of a file.
# Disabled by default as each occurrence is already logged
# as a fileinfo record to the main eve-log.
write-fileinfo: no
# Force storing of all files. Default: no.
force-filestore: no
# Override the global stream-depth for sessions in which we want
# to perform file extraction. Set to 0 for unlimited; otherwise,
# must be greater than the global stream-depth value to be used.
#stream-depth: 0
# Uncomment the following variable to define how many files can
# remain open for filestore by Suricata. Default value is 0 which
# means files get closed after each write to the file.
#max-open-files: 1000
# Force logging of checksums: available hash functions are md5,
# sha1 and sha256. Note that SHA256 is automatically forced by
# the use of this output module as it uses the SHA256 as the
# file naming scheme.
force-hash: [sha1, md5]
# NOTE: X-Forwarded configuration is ignored if write-fileinfo is disabled
# HTTP X-Forwarded-For support by adding an extra field or overwriting
# the source or destination IP address (depending on flow direction)
# with the one reported in the X-Forwarded-For HTTP header. This is
# helpful when reviewing alerts for traffic that is being reverse
# or forward proxied.
xff:
enabled: no
# Two operation modes are available, "extra-data" and "overwrite".
mode: extra-data
# Two proxy deployments are supported, "reverse" and "forward". In
# a "reverse" deployment the IP address used is the last one, in a
# "forward" deployment the first IP address is used.
deployment: reverse
# Header name where the actual IP address will be reported. If more
# than one IP address is present, the last IP address will be the
# one taken into consideration.
header: X-Forwarded-For
# Log TCP data after stream normalization
# Two types: file or dir:
# - file logs into a single logfile.
# - dir creates 2 files per TCP session and stores the raw TCP
# data into them.
# Use 'both' to enable both file and dir modes.
#
# Note: limited by "stream.reassembly.depth"
- tcp-data:
enabled: no
type: both
filename: tcp-data.log
# Log HTTP body data after normalization, de-chunking and unzipping.
# Two types: file or dir.
# - file logs into a single logfile.
# - dir creates 2 files per HTTP session and stores the
# normalized data into them.
# Use 'both' to enable both file and dir modes.
#
# Note: limited by the body limit settings
- http-body-data:
enabled: no
type: both
filename: http-data.log
# Lua Output Support - execute lua script to generate alert and event
# output.
# Documented at:
# https://suricata.readthedocs.io/en/latest/output/lua-output.html
- lua:
enabled: no
#scripts-dir: /etc/suricata/lua-output/
scripts:
# - script1.lua
# Logging configuration. This is not about logging IDS alerts/events, but
# output about what Suricata is doing, like startup messages, errors, etc.
logging:
# The default log level: can be overridden in an output section.
# Note that debug level logging will only be emitted if Suricata was
# compiled with the --enable-debug configure option.
#
# This value is overridden by the SC_LOG_LEVEL env var.
default-log-level: notice
# The default output format. Optional parameter, should default to
# something reasonable if not provided. Can be overridden in an
# output section. You can leave this out to get the default.
#
# This value is overridden by the SC_LOG_FORMAT env var.
#default-log-format: "[%i] %t - (%f:%l) <%d> (%n) -- "
# A regex to filter output. Can be overridden in an output section.
# Defaults to empty (no filter).
#
# This value is overridden by the SC_LOG_OP_FILTER env var.
default-output-filter:
# Requires libunwind to be available when Suricata is configured and built.
# If a signal unexpectedly terminates Suricata, displays a brief diagnostic
# message with the offending stacktrace if enabled.
#stacktrace-on-signal: on
# Define your logging outputs. If none are defined, or they are all
# disabled you will get the default: console output.
outputs:
- console:
enabled: yes
# type: json
- file:
enabled: yes
level: info
filename: suricata.log
type: json
- syslog:
enabled: no
facility: local5
format: "[%i] <%d> -- "
type: json
##
## Step 3: Configure common capture settings
##
## See "Advanced Capture Options" below for more options, including Netmap
## and PF_RING.
##
# Linux high speed capture support
af-packet:
#- interface: ens33
## Number of receive threads. "auto" uses the number of cores
#threads: auto
## Default clusterid. AF_PACKET will load balance packets based on flow.
#cluster-id: 99
## Default AF_PACKET cluster type. AF_PACKET can load balance per flow or per hash.
## This is only supported for Linux kernel > 3.1
## possible value are:
## * cluster_flow: all packets of a given flow are sent to the same socket
## * cluster_cpu: all packets treated in kernel by a CPU are sent to the same socket
## * cluster_qm: all packets linked by network card to a RSS queue are sent to the same
## socket. Requires at least Linux 3.14.
## * cluster_ebpf: eBPF file load balancing. See doc/userguide/capture-hardware/ebpf-xdp.rst for
## more info.
## Recommended modes are cluster_flow on most boxes and cluster_cpu or cluster_qm on system
## with capture card using RSS (requires cpu affinity tuning and system IRQ tuning)
#cluster-type: cluster_flow
## In some fragmentation cases, the hash can not be computed. If "defrag" is set
## to yes, the kernel will do the needed defragmentation before sending the packets.
#defrag: yes
## To use the ring feature of AF_PACKET, set 'use-mmap' to yes
##use-mmap: yes
## Lock memory map to avoid it being swapped. Be careful that over
## subscribing could lock your system
##mmap-locked: yes
## Use tpacket_v3 capture mode, only active if use-mmap is true
## Don't use it in IPS or TAP mode as it causes severe latency
##tpacket-v3: yes
## Ring size will be computed with respect to "max-pending-packets" and number
## of threads. You can set manually the ring size in number of packets by setting
## the following value. If you are using flow "cluster-type" and have really network
## intensive single-flow you may want to set the "ring-size" independently of the number
## of threads:
##ring-size: 2048
## Block size is used by tpacket_v3 only. It should set to a value high enough to contain
## a decent number of packets. Size is in bytes so please consider your MTU. It should be
## a power of 2 and it must be multiple of page size (usually 4096).
##block-size: 32768
## tpacket_v3 block timeout: an open block is passed to userspace if it is not
## filled after block-timeout milliseconds.
##block-timeout: 10
## On busy systems, set it to yes to help recover from a packet drop
## phase. This will result in some packets (at max a ring flush) not being inspected.
##use-emergency-flush: yes
## recv buffer size, increased value could improve performance
## buffer-size: 32768
## Set to yes to disable promiscuous mode
## disable-promisc: no
## Choose checksum verification mode for the interface. At the moment
## of the capture, some packets may have an invalid checksum due to
## the checksum computation being offloaded to the network card.
## Possible values are:
## - kernel: use indication sent by kernel for each packet (default)
## - yes: checksum validation is forced
## - no: checksum validation is disabled
## - auto: Suricata uses a statistical approach to detect when
## checksum off-loading is used.
## Warning: 'capture.checksum-validation' must be set to yes to have any validation
##checksum-checks: kernel
## BPF filter to apply to this interface. The pcap filter syntax applies here.
##bpf-filter: port 80 or udp
## You can use the following variables to activate AF_PACKET tap or IPS mode.
## If copy-mode is set to ips or tap, the traffic coming to the current
## interface will be copied to the copy-iface interface. If 'tap' is set, the
## copy is complete. If 'ips' is set, the packet matching a 'drop' action
## will not be copied.
##copy-mode: ips
##copy-iface: ens33
## For eBPF and XDP setup including bypass, filter and load balancing, please
## see doc/userguide/capture-hardware/ebpf-xdp.rst for more info.
# Put default values here. These will be used for an interface that is not
# in the list above.
- interface: ens33
threads: auto
cluster-id: 99
cluster-type: cluster_flow
mmap-locked: yes
tpacket-v3: yes
#ring-size: 2048
#block-size: 104858
# Cross platform libpcap capture support
pcap:
- interface: ens33
# On Linux, pcap will try to use mmap'ed capture and will use "buffer-size"
# as total memory used by the ring. So set this to something bigger
# than 1% of your bandwidth.
#buffer-size: 16777216
#bpf-filter: "tcp and port 25"
# Choose checksum verification mode for the interface. At the moment
# of the capture, some packets may have an invalid checksum due to
# the checksum computation being offloaded to the network card.
# Possible values are:
# - yes: checksum validation is forced
# - no: checksum validation is disabled
# - auto: Suricata uses a statistical approach to detect when
# checksum off-loading is used. (default)
# Warning: 'capture.checksum-validation' must be set to yes to have any validation
#checksum-checks: auto
# With some accelerator cards using a modified libpcap (like Myricom), you
# may want to have the same number of capture threads as the number of capture
# rings. In this case, set up the threads variable to N to start N threads
# listening on the same interface.
#threads: 16
# set to no to disable promiscuous mode:
#promisc: no
# set snaplen, if not set it defaults to MTU if MTU can be known
# via ioctl call and to full capture if not.
#snaplen: 1518
# Put default values here
- interface: default
#checksum-checks: auto
# Settings for reading pcap files
pcap-file:
# Possible values are:
# - yes: checksum validation is forced
# - no: checksum validation is disabled
# - auto: Suricata uses a statistical approach to detect when
# checksum off-loading is used. (default)
# Warning: 'checksum-validation' must be set to yes to have checksum tested
checksum-checks: auto
# See "Advanced Capture Options" below for more options, including Netmap
# and PF_RING.
##
## Step 4: App Layer Protocol configuration
##
# Configure the app-layer parsers.
#
# The error-policy setting applies to all app-layer parsers. Values can be
# "drop-flow", "pass-flow", "bypass", "drop-packet", "pass-packet", "reject" or
# "ignore" (the default).
#
# The protocol's section details each protocol.
#
# The option "enabled" takes 3 values - "yes", "no", "detection-only".
# "yes" enables both detection and the parser, "no" disables both, and
# "detection-only" enables protocol detection only (parser disabled).
app-layer:
# error-policy: ignore
protocols:
rfb:
enabled: yes
detection-ports:
dp: 5900, 5901, 5902, 5903, 5904, 5905, 5906, 5907, 5908, 5909
# MQTT, disabled by default.
mqtt:
enabled: yes
# max-msg-length: 1mb
# subscribe-topic-match-limit: 100
# unsubscribe-topic-match-limit: 100
# Maximum number of live MQTT transactions per flow
# max-tx: 4096
krb5:
enabled: yes
snmp:
enabled: yes
ikev2:
enabled: yes
tls:
enabled: yes
detection-ports:
dp: 443
# Generate JA3 fingerprint from client hello. If not specified it
# will be disabled by default, but enabled if rules require it.
ja3-fingerprints: yes
# What to do when the encrypted communications start:
# - default: keep tracking TLS session, check for protocol anomalies,
# inspect tls_* keywords. Disables inspection of unmodified
# 'content' signatures.
# - bypass: stop processing this flow as much as possible. No further
# TLS parsing and inspection. Offload flow bypass to kernel
# or hardware if possible.
# - full: keep tracking and inspection as normal. Unmodified content
# keyword signatures are inspected as well.
#
# For best performance, select 'bypass'.
#
# encryption-handling: default
encryption-handling: bypass
dcerpc:
enabled: yes
ftp:
enabled: yes
# memcap: 64mb
rdp:
enabled: yes
ssh:
enabled: yes
#hassh: yes
# HTTP2: Experimental HTTP 2 support. Disabled by default.
http2:
enabled: no
# use http keywords on HTTP2 traffic
http1-rules: no
smtp:
enabled: yes
raw-extraction: no
# Configure SMTP-MIME Decoder
mime:
# Decode MIME messages from SMTP transactions
# (may be resource intensive)
# This field supersedes all others because it turns the entire
# process on or off
decode-mime: yes
# Decode MIME entity bodies (ie. Base64, quoted-printable, etc.)
decode-base64: yes
decode-quoted-printable: yes
# Maximum bytes per header data value stored in the data structure
# (default is 2000)
header-value-depth: 2000
# Extract URLs and save in state data structure
extract-urls: yes
# Set to yes to compute the md5 of the mail body. You will then
# be able to journalize it.
body-md5: no
# Configure inspected-tracker for file_data keyword
inspected-tracker:
content-limit: 100000
content-inspect-min-size: 32768
content-inspect-window: 4096
imap:
enabled: detection-only
smb:
enabled: yes
detection-ports:
dp: 139, 445
# Stream reassembly size for SMB streams. By default track it completely.
#stream-depth: 0
nfs:
enabled: yes
tftp:
enabled: yes
dns:
tcp:
enabled: yes
detection-ports:
dp: 53
udp:
enabled: yes
detection-ports:
dp: 53
http:
enabled: yes
# memcap: Maximum memory capacity for HTTP
# Default is unlimited, values can be 64mb, e.g.
# default-config: Used when no server-config matches
# personality: List of personalities used by default
# request-body-limit: Limit reassembly of request body for inspection
# by http_client_body & pcre /P option.
# response-body-limit: Limit reassembly of response body for inspection
# by file_data, http_server_body & pcre /Q option.
#
# For advanced options, see the user guide
# server-config: List of server configurations to use if address matches
# address: List of IP addresses or networks for this block
# personality: List of personalities used by this block
#
# Then, all the fields from default-config can be overloaded
#
# Currently Available Personalities:
# Minimal, Generic, IDS (default), IIS_4_0, IIS_5_0, IIS_5_1, IIS_6_0,
# IIS_7_0, IIS_7_5, Apache_2
libhtp:
default-config:
personality: IDS
# Can be specified in kb, mb, gb. Just a number indicates
# it's in bytes.
request-body-limit: 100kb
response-body-limit: 100kb
# inspection limits
request-body-minimal-inspect-size: 32kb
request-body-inspect-window: 4kb
response-body-minimal-inspect-size: 40kb
response-body-inspect-window: 16kb
# response body decompression (0 disables)
response-body-decompress-layer-limit: 2
# auto will use http-body-inline mode in IPS mode, yes or no set it statically
http-body-inline: auto
# Decompress SWF files.
# Two types: 'deflate', 'lzma', 'both' will decompress deflate and lzma
# compress-depth:
# Specifies the maximum amount of data to decompress,
# set 0 for unlimited.
# decompress-depth:
# Specifies the maximum amount of decompressed data to obtain,
# set 0 for unlimited.
swf-decompression:
enabled: yes
type: both
compress-depth: 100kb
decompress-depth: 100kb
# Use a random value for inspection sizes around the specified value.
# This lowers the risk of some evasion techniques but could lead
# to detection change between runs. It is set to 'yes' by default.
#randomize-inspection-sizes: yes
# If "randomize-inspection-sizes" is active, the value of various
# inspection size will be chosen from the [1 - range%, 1 + range%]
# range
# Default value of "randomize-inspection-range" is 10.
#randomize-inspection-range: 10
# decoding
double-decode-path: no
double-decode-query: no
# Can enable LZMA decompression
#lzma-enabled: false
# Memory limit usage for LZMA decompression dictionary
# Data is decompressed until dictionary reaches this size
#lzma-memlimit: 1mb
# Maximum decompressed size with a compression ratio
# above 2048 (only LZMA can reach this ratio, deflate cannot)
#compression-bomb-limit: 1mb
# Maximum time spent decompressing a single transaction in usec
#decompression-time-limit: 100000
server-config:
#- apache:
# address: [192.168.1.0/24, 127.0.0.0/8, "::1"]
# personality: Apache_2
# # Can be specified in kb, mb, gb. Just a number indicates
# # it's in bytes.
# request-body-limit: 4096
# response-body-limit: 4096
# double-decode-path: no
# double-decode-query: no
#- iis7:
# address:
# - 192.168.0.0/24
# - 192.168.10.0/24
# personality: IIS_7_0
# # Can be specified in kb, mb, gb. Just a number indicates
# # it's in bytes.
# request-body-limit: 4096
# response-body-limit: 4096
# double-decode-path: no
# double-decode-query: no
# Note: Modbus probe parser is minimalist due to the limited usage in the field.
# Only Modbus message length (greater than Modbus header length)
# and protocol ID (equal to 0) are checked in probing parser
# It is important to enable detection port and define Modbus port
# to avoid false positives
modbus:
# How many unanswered Modbus requests are considered a flood.
# If the limit is reached, the app-layer-event:modbus.flooded; will match.
#request-flood: 500
enabled: no
detection-ports:
dp: 502
# According to MODBUS Messaging on TCP/IP Implementation Guide V1.0b, it
# is recommended to keep the TCP connection opened with a remote device
# and not to open and close it for each MODBUS/TCP transaction. In that
# case, it is important to set the depth of the stream reassembling as
# unlimited (stream.reassembly.depth: 0)
# Stream reassembly size for modbus. By default track it completely.
stream-depth: 0
# DNP3
dnp3:
enabled: no
detection-ports:
dp: 20000
# SCADA EtherNet/IP and CIP protocol support
enip:
enabled: no
detection-ports:
dp: 44818
sp: 44818
ntp:
enabled: no
dhcp:
enabled: no
sip:
enabled: no
# Limit for the maximum number of asn1 frames to decode (default 256)
asn1-max-frames: 256
# Datasets default settings
# datasets:
# # Default fallback memcap and hashsize values for datasets in case these
# # were not explicitly defined.
# defaults:
# memcap: 100mb
# hashsize: 2048
##############################################################################
##
## Advanced settings below
##
##############################################################################
##
## Run Options
##
# Run Suricata with a specific user-id and group-id:
#run-as:
# user: suri
# group: suri
# Some logging modules will use that name in event as identifier. The default
# value is the hostname
sensor-name: suricata_sensor
# Default location of the pid file. The pid file is only used in
# daemon mode (start Suricata with -D). If not running in daemon mode
# the --pidfile command line option must be used to create a pid file.
pid-file: /etc/suricata/suricata.pid
# Daemon working directory
# Suricata will change directory to this one if provided
# Default: "/"
#daemon-directory: "/"
# Umask.
# Suricata will use this umask if it is provided. By default it will use the
# umask passed on by the shell.
#umask: 022
# Suricata core dump configuration. Limits the size of the core dump file to
# approximately max-dump. The actual core dump size will be a multiple of the
# page size. Core dumps that would be larger than max-dump are truncated. On
# Linux, the actual core dump size may be a few pages larger than max-dump.
# Setting max-dump to 0 disables core dumping.
# Setting max-dump to 'unlimited' will give the full core dump file.
# On 32-bit Linux, a max-dump value >= ULONG_MAX may cause the core dump size
# to be 'unlimited'.
coredump:
max-dump: unlimited
# If the Suricata box is a router for the sniffed networks, set it to 'router'. If
# it is a pure sniffing setup, set it to 'sniffer-only'.
# If set to auto, the variable is internally switched to 'router' in IPS mode
# and 'sniffer-only' in IDS mode.
# This feature is currently only used by the reject* keywords.
host-mode: sniffer-only
# Number of packets preallocated per thread. The default is 1024. A higher number
# will make sure each CPU will be more easily kept busy, but may negatively
# impact caching.
#max-pending-packets: 1024
# Runmode the engine should use. Please check --list-runmodes to get the available
# runmodes for each packet acquisition method. Default depends on selected capture
# method. 'workers' generally gives best performance.
runmode: workers
# Specifies the kind of flow load balancer used by the flow pinned autofp mode.
#
# Supported schedulers are:
#
# hash - Flow assigned to threads using the 5-7 tuple hash.
# ippair - Flow assigned to threads using addresses only.
#
#autofp-scheduler: hash
# Preallocated size for each packet. Default is 1514 which is the classical
# size for pcap on Ethernet. You should adjust this value to the highest
# packet size (MTU + hardware header) on your system.
#default-packet-size: 1514
# Unix command socket that can be used to pass commands to Suricata.
# An external tool can then connect to get information from Suricata
# or trigger some modifications of the engine. Set enabled to yes
# to activate the feature. In auto mode, the feature will only be
# activated in live capture mode. You can use the filename variable to set
# the file name of the socket.
unix-command:
enabled: auto
#filename: custom.socket
# Magic file. The extension .mgc is added to the value here.
#magic-file: /usr/share/file/magic
#magic-file:
# GeoIP2 database file. Specify path and filename of GeoIP2 database
# if using rules with "geoip" rule option.
# geoip-database: /etc/suricata/GeoLite2-Country.mmdb
legacy:
uricontent: enabled
##
## Detection settings
##
# Set the order of alerts based on actions
# The default order is pass, drop, reject, alert
# action-order:
# - pass
# - drop
# - reject
# - alert
# Define maximum number of possible alerts that can be triggered for the same
# packet. Default is 15
#packet-alert-max: 15
# IP Reputation
# reputation-categories-file: /etc/suricata/iprep/categories.txt
# default-reputation-path: /etc/suricata/iprep
# reputation-files:
# - reputation.list
# When run with the option --engine-analysis, the engine will read each of
# the parameters below, and print reports for each of the enabled sections
# and exit. The reports are printed to a file in the default log dir
# given by the parameter "default-log-dir", with engine reporting
# subsection below printing reports in its own report file.
engine-analysis:
# enables printing reports for fast-pattern for every rule.
rules-fast-pattern: yes
# enables printing reports for each rule
rules: yes
#recursion and match limits for PCRE where supported
pcre:
match-limit: 3500
match-limit-recursion: 1500
##
## Advanced Traffic Tracking and Reconstruction Settings
##
# Host specific policies for defragmentation and TCP stream
# reassembly. The host OS lookup is done using a radix tree, just
# like a routing table so the most specific entry matches.
host-os-policy:
# Make the default policy windows.
windows: [0.0.0.0/0]
bsd: []
bsd-right: []
old-linux: []
linux: []
old-solaris: []
solaris: []
hpux10: []
hpux11: []
irix: []
macos: []
vista: []
windows2k3: []
# Defrag settings:
# The memcap-policy value can be "drop-flow", "pass-flow", "bypass",
# "drop-packet", "pass-packet", "reject" or "ignore" (which is the default).
defrag:
memcap: 32mb
# memcap-policy: ignore
hash-size: 65536
trackers: 65535 # number of defragmented flows to follow
max-frags: 65535 # number of fragments to keep (higher than trackers)
prealloc: yes
timeout: 60
# Enable defrag per host settings
# host-config:
#
# - dmz:
# timeout: 30
# address: [192.168.1.0/24, 127.0.0.0/8, 1.1.1.0/24, 2.2.2.0/24, "1.1.1.1", "2.2.2.2", "::1"]
#
# - lan:
# timeout: 45
# address:
# - 192.168.0.0/24
# - 192.168.10.0/24
# - 172.16.14.0/24
# Flow settings:
# By default, the reserved memory (memcap) for flows is 32MB. This is the limit
# for flow allocation inside the engine. You can change this value to allow
# more memory usage for flows.
# The hash-size determines the size of the hash used to identify flows inside
# the engine, and by default the value is 65536.
# At startup, the engine can preallocate a number of flows, to get better
# performance. The number of flows preallocated is 10000 by default.
# emergency-recovery is the percentage of flows that the engine needs to
# prune before clearing the emergency state. The emergency state is activated
# when the memcap limit is reached, allowing new flows to be created, but
# pruning them with the emergency timeouts (they are defined below).
# If the memcap is reached, the engine will try to prune flows
# with the default timeouts. If it doesn't find a flow to prune, it will set
# the emergency bit and it will try again with more aggressive timeouts.
# If that doesn't work, then it will try to kill the oldest flows using
# last time seen flows.
# The memcap can be specified in kb, mb, gb. Just a number indicates it's
# in bytes.
# The memcap-policy can be "drop-flow", "pass-flow", "bypass", "drop-packet",
# "pass-packet", "reject" or "ignore" (which is the default).
flow:
memcap: 128mb
#memcap-policy: ignore
hash-size: 65536
prealloc: 10000
emergency-recovery: 30
#managers: 1 # default to one flow manager
#recyclers: 1 # default to one flow recycler thread
# This option controls the use of VLAN ids in the flow (and defrag)
# hashing. Normally this should be enabled, but in some (broken)
# setups where both sides of a flow are not tagged with the same VLAN
# tag, we can ignore the VLAN id's in the flow hashing.
vlan:
use-for-tracking: false
# Specific timeouts for flows. Here you can specify the timeouts that the
# active flows will wait to transit from the current state to another, on each
# protocol. The value of "new" determines the seconds to wait after a handshake or
# stream startup before the engine frees the data of that flow it doesn't
# change the state to established (usually if we don't receive more packets
# of that flow). The value of "established" is the amount of
# seconds that the engine will wait to free the flow if that time elapses
# without receiving new packets or closing the connection. "closed" is the
# amount of time to wait after a flow is closed (usually zero). "bypassed"
# timeout controls locally bypassed flows. For these flows we don't do any other
# tracking. If no packets have been seen after this timeout, the flow is discarded.
#
# There's an emergency mode that will become active under attack circumstances,
# making the engine to check flow status faster. This configuration variables
# use the prefix "emergency-" and work similar as the normal ones.
# Some timeouts doesn't apply to all the protocols, like "closed", for udp and
# icmp.
flow-timeouts:
default:
new: 30
established: 300
closed: 0
bypassed: 100
emergency-new: 10
emergency-established: 100
emergency-closed: 0
emergency-bypassed: 50
tcp:
new: 60
established: 600
closed: 60
bypassed: 100
emergency-new: 5
emergency-established: 100
emergency-closed: 10
emergency-bypassed: 50
udp:
new: 30
established: 300
bypassed: 100
emergency-new: 10
emergency-established: 100
emergency-bypassed: 50
icmp:
new: 30
established: 300
bypassed: 100
emergency-new: 10
emergency-established: 100
emergency-bypassed: 50
# Stream engine settings. Here the TCP stream tracking and reassembly
# engine is configured.
#
# stream:
# memcap: 64mb # Can be specified in kb, mb, gb. Just a
# # number indicates it's in bytes.
# memcap-policy: ignore # Can be "drop-flow", "pass-flow", "bypass",
# # "drop-packet", "pass-packet", "reject" or
# # "ignore" default is "ignore"
# checksum-validation: yes # To validate the checksum of received
# # packet. If csum validation is specified as
# # "yes", then packets with invalid csum values will not
# # be processed by the engine stream/app layer.
# # Warning: locally generated traffic can be
# # generated without checksum due to hardware offload
# # of checksum. You can control the handling of checksum
# # on a per-interface basis via the 'checksum-checks'
# # option
# prealloc-sessions: 2k # 2k sessions prealloc'd per stream thread
# midstream: false # don't allow midstream session pickups
# midstream-policy: ignore # Can be "drop-flow", "pass-flow", "bypass",
# # "drop-packet", "pass-packet", "reject" or
# # "ignore" default is "ignore"
# async-oneside: false # don't enable async stream handling
# inline: no # stream inline mode
# drop-invalid: yes # in inline mode, drop packets that are invalid with regards to streaming engine
# max-synack-queued: 5 # Max different SYN/ACKs to queue
# bypass: no # Bypass packets when stream.reassembly.depth is reached.
# # Warning: first side to reach this triggers
# # the bypass.
#
# reassembly:
# memcap: 256mb # Can be specified in kb, mb, gb. Just a number
# # indicates it's in bytes.
# memcap-policy: ignore # Can be "drop-flow", "pass-flow", "bypass",
# # "drop-packet", "pass-packet", "reject" or
# # "ignore" default is "ignore"
# depth: 1mb # Can be specified in kb, mb, gb. Just a number
# # indicates it's in bytes.
# toserver-chunk-size: 2560 # inspect raw stream in chunks of at least
# # this size. Can be specified in kb, mb,
# # gb. Just a number indicates it's in bytes.
# toclient-chunk-size: 2560 # inspect raw stream in chunks of at least
# # this size. Can be specified in kb, mb,
# # gb. Just a number indicates it's in bytes.
# randomize-chunk-size: yes # Take a random value for chunk size around the specified value.
# # This lowers the risk of some evasion techniques but could lead
# # to detection change between runs. It is set to 'yes' by default.
# randomize-chunk-range: 10 # If randomize-chunk-size is active, the value of chunk-size is
# # a random value between (1 - randomize-chunk-range/100)*toserver-chunk-size
# # and (1 + randomize-chunk-range/100)*toserver-chunk-size and the same
# # calculation for toclient-chunk-size.
# # Default value of randomize-chunk-range is 10.
#
# raw: yes # 'Raw' reassembly enabled or disabled.
# # raw is for content inspection by detection
# # engine.
#
# segment-prealloc: 2048 # number of segments preallocated per thread
#
# check-overlap-different-data: true|false
# # check if a segment contains different data
# # than what we've already seen for that
# # position in the stream.
# # This is enabled automatically if inline mode
# # is used or when stream-event:reassembly_overlap_different_data;
# # is used in a rule.
#
stream:
memcap: 64mb
#memcap-policy: ignore
checksum-validation: yes # reject incorrect csums
#midstream: false
#midstream-policy: ignore
inline: auto # auto will use inline mode in IPS mode, yes or no set it statically
reassembly:
memcap: 256mb
#memcap-policy: ignore
depth: 1mb # reassemble 1mb into a stream
toserver-chunk-size: 2560
toclient-chunk-size: 2560
randomize-chunk-size: yes
#randomize-chunk-range: 10
#raw: yes
#segment-prealloc: 2048
#check-overlap-different-data: true
# Host table:
#
# Host table is used by the tagging and per host thresholding subsystems.
#
host:
hash-size: 4096
prealloc: 1000
memcap: 32mb
# IP Pair table:
#
# Used by xbits 'ippair' tracking.
#
#ippair:
# hash-size: 4096
# prealloc: 1000
# memcap: 32mb
# Decoder settings
decoder:
# Teredo decoder is known to not be completely accurate
# as it will sometimes detect non-teredo as teredo.
teredo:
enabled: true
# ports to look for Teredo. Max 4 ports. If no ports are given, or
# the value is set to 'any', Teredo detection runs on _all_ UDP packets.
ports: $TEREDO_PORTS # syntax: '[3544, 1234]' or '3533' or 'any'.
# VXLAN decoder is assigned to up to 4 UDP ports. By default only the
# IANA assigned port 4789 is enabled.
vxlan:
enabled: true
ports: $VXLAN_PORTS # syntax: '[8472, 4789]' or '4789'.
# VNTag decode support
vntag:
enabled: false
# Geneve decoder is assigned to up to 4 UDP ports. By default only the
# IANA assigned port 6081 is enabled.
geneve:
enabled: true
ports: $GENEVE_PORTS # syntax: '[6081, 1234]' or '6081'.
# maximum number of decoder layers for a packet
# max-layers: 16
##
## Performance tuning and profiling
##
# The detection engine builds internal groups of signatures. The engine
# allows us to specify the profile to use for them, to manage memory in an
# efficient way keeping good performance. For the profile keyword you
# can use the words "low", "medium", "high" or "custom". If you use custom,
# make sure to define the values in the "custom-values" section.
# Usually you would prefer medium/high/low.
#
# "sgh mpm-context", indicates how the staging should allot mpm contexts for
# the signature groups. "single" indicates the use of a single context for
# all the signature group heads. "full" indicates a mpm-context for each
# group head. "auto" lets the engine decide the distribution of contexts
# based on the information the engine gathers on the patterns from each
# group head.
#
# The option inspection-recursion-limit is used to limit the recursive calls
# in the content inspection code. For certain payload-sig combinations, we
# might end up taking too much time in the content inspection code.
# If the argument specified is 0, the engine uses an internally defined
# default limit. When a value is not specified, there are no limits on the recursion.
detect:
# https://www.jianshu.com/p/d8ba12706861?utm_campaign=maleskine&utm_content=note&utm_medium=seo_notes
profile: custom
custom-values:
toclient-groups: 200
toserver-groups: 200
sgh-mpm-context: auto
inspection-recursion-limit: 3000
# If set to yes, the loading of signatures will be made after the capture
# is started. This will limit the downtime in IPS mode.
#delayed-detect: yes
#profile: medium
#custom-values:
# toclient-groups: 3
# toserver-groups: 25
#sgh-mpm-context: auto
#inspection-recursion-limit: 3000
## If set to yes, the loading of signatures will be made after the capture
## is started. This will limit the downtime in IPS mode.
##delayed-detect: yes
prefilter:
# default prefiltering setting. "mpm" only creates MPM/fast_pattern
# engines. "auto" also sets up prefilter engines for other keywords.
# Use --list-keywords=all to see which keywords support prefiltering.
# fast_pattern
default: mpm
# the grouping values above control how many groups are created per
# direction. Port whitelisting forces that port to get its own group.
# Very common ports will benefit, as well as ports with many expensive
# rules.
grouping:
#tcp-whitelist: 53, 80, 139, 443, 445, 1433, 3306, 3389, 6666, 6667, 8080
#udp-whitelist: 53, 135, 5060
profiling:
# Log the rules that made it past the prefilter stage, per packet
# default is off. The threshold setting determines how many rules
# must have made it past pre-filter for that rule to trigger the
# logging.
#inspect-logging-threshold: 200
grouping:
dump-to-disk: false
include-rules: false # very verbose
include-mpm-stats: false
# Select the multi pattern algorithm you want to run for scan/search the
# in the engine.
#
# The supported algorithms are:
# "ac" - Aho-Corasick, default implementation
# "ac-bs" - Aho-Corasick, reduced memory implementation
# "ac-ks" - Aho-Corasick, "Ken Steele" variant
# "hs" - Hyperscan, available when built with Hyperscan support
#
# The default mpm-algo value of "auto" will use "hs" if Hyperscan is
# available, "ac" otherwise.
#
# The mpm you choose also decides the distribution of mpm contexts for
# signature groups, specified by the conf - "detect.sgh-mpm-context".
# Selecting "ac" as the mpm would require "detect.sgh-mpm-context"
# to be set to "single", because of ac's memory requirements, unless the
# ruleset is small enough to fit in memory, in which case one can
# use "full" with "ac". The rest of the mpms can be run in "full" mode.
# On x86_64 hs (Hyperscan) should be used for best performance.
mpm-algo: ac-ks
# Select the matching algorithm you want to use for single-pattern searches.
#
# Supported algorithms are "bm" (Boyer-Moore) and "hs" (Hyperscan, only
# available if Suricata has been built with Hyperscan support).
#
# The default of "auto" will use "hs" if available, otherwise "bm".
spm-algo: auto
# Suricata is multi-threaded. Here the threading can be influenced.
threading:
set-cpu-affinity: no
# Tune cpu affinity of threads. Each family of threads can be bound
# to specific CPUs.
#
# These 2 apply to the all runmodes:
# management-cpu-set is used for flow timeout handling, counters
# worker-cpu-set is used for 'worker' threads
#
# Additionally, for autofp these apply:
# receive-cpu-set is used for capture threads
# verdict-cpu-set is used for IPS verdict threads
#
cpu-affinity:
- management-cpu-set:
cpu: [ 0 ] # include only these CPUs in affinity settings
- receive-cpu-set:
cpu: [ 0 ] # include only these CPUs in affinity settings
- worker-cpu-set:
cpu: [ "all" ]
mode: "exclusive"
# Use explicitly 3 threads and don't compute number by using
# detect-thread-ratio variable:
# threads: 3
prio:
low: [ 0 ]
medium: [ "1-2" ]
high: [ 3 ]
default: "medium"
#- verdict-cpu-set:
# cpu: [ 0 ]
# prio:
# default: "high"
#
# By default Suricata creates one "detect" thread per available CPU/CPU core.
# This setting allows controlling this behaviour. A ratio setting of 2 will
# create 2 detect threads for each CPU/CPU core. So for a dual core CPU this
# will result in 4 detect threads. If values below 1 are used, less threads
# are created. So on a dual core CPU a setting of 0.5 results in 1 detect
# thread being created. Regardless of the setting at a minimum 1 detect
# thread will always be created.
#
detect-thread-ratio: 1.0
#
# By default, the per-thread stack size is left to its default setting. If
# the default thread stack size is too small, use the following configuration
# setting to change the size. Note that if any thread's stack size cannot be
# set to this value, a fatal error occurs.
#
# Generally, the per-thread stack-size should not exceed 8MB.
#stack-size: 8mb
# Luajit has a strange memory requirement, its 'states' need to be in the
# first 2G of the process' memory.
#
# 'luajit.states' is used to control how many states are preallocated.
# State use: per detect script: 1 per detect thread. Per output script: 1 per
# script.
luajit:
states: 128
# Profiling settings. Only effective if Suricata has been built with
# the --enable-profiling configure flag.
#
profiling:
# Run profiling for every X-th packet. The default is 1, which means we
# profile every packet. If set to 1000, one packet is profiled for every
# 1000 received.
#sample-rate: 1000
# rule profiling
rules:
# Profiling can be disabled here, but it will still have a
# performance impact if compiled in.
enabled: yes
filename: rule_perf.log
append: yes
# Sort options: ticks, avgticks, checks, matches, maxticks
# If commented out all the sort options will be used.
#sort: avgticks
# Limit the number of sids for which stats are shown at exit (per sort).
limit: 10
# output to json
json: yes
# per keyword profiling
keywords:
enabled: yes
filename: keyword_perf.log
append: yes
prefilter:
enabled: yes
filename: prefilter_perf.log
append: yes
# per rulegroup profiling
rulegroups:
enabled: yes
filename: rule_group_perf.log
append: yes
# packet profiling
packets:
# Profiling can be disabled here, but it will still have a
# performance impact if compiled in.
enabled: yes
filename: packet_stats.log
append: yes
# per packet csv output
csv:
# Output can be disabled here, but it will still have a
# performance impact if compiled in.
enabled: yes
filename: packet_stats.csv
# profiling of locking. Only available when Suricata was built with
# --enable-profiling-locks.
locks:
enabled: no
filename: lock_stats.log
append: yes
pcap-log:
enabled: no
filename: pcaplog_stats.log
append: yes
##
## Netfilter integration
##
# When running in NFQ inline mode, it is possible to use a simulated
# non-terminal NFQUEUE verdict.
# This permits sending all needed packet to Suricata via this rule:
# iptables -I FORWARD -m mark ! --mark $MARK/$MASK -j NFQUEUE
# And below, you can have your standard filtering ruleset. To activate
# this mode, you need to set mode to 'repeat'
# If you want a packet to be sent to another queue after an ACCEPT decision
# set the mode to 'route' and set next-queue value.
# On Linux >= 3.1, you can set batchcount to a value > 1 to improve performance
# by processing several packets before sending a verdict (worker runmode only).
# On Linux >= 3.6, you can set the fail-open option to yes to have the kernel
# accept the packet if Suricata is not able to keep pace.
# bypass mark and mask can be used to implement NFQ bypass. If bypass mark is
# set then the NFQ bypass is activated. Suricata will set the bypass mark/mask
# on packet of a flow that need to be bypassed. The Nefilter ruleset has to
# directly accept all packets of a flow once a packet has been marked.
nfq:
# mode: accept
# repeat-mark: 1
# repeat-mask: 1
# bypass-mark: 1
# bypass-mask: 1
# route-queue: 2
# batchcount: 20
# fail-open: yes
#nflog support
nflog:
# netlink multicast group
# (the same as the iptables --nflog-group param)
# Group 0 is used by the kernel, so you can't use it
- group: 2
# netlink buffer size
buffer-size: 18432
# put default value here
- group: default
# set number of packets to queue inside kernel
qthreshold: 1
# set the delay before flushing packet in the kernel's queue
qtimeout: 100
# netlink max buffer size
max-size: 20000
##
## Advanced Capture Options
##
# General settings affecting packet capture
capture:
# disable NIC offloading. It's restored when Suricata exits.
# Enabled by default.
#disable-offloading: false
#
# disable checksum validation. Same as setting '-k none' on the
# commandline.
#checksum-validation: none
# Netmap support
#
# Netmap operates with NIC directly in driver, so you need FreeBSD 11+ which has
# built-in Netmap support or compile and install the Netmap module and appropriate
# NIC driver for your Linux system.
# To reach maximum throughput disable all receive-, segmentation-,
# checksum- offloading on your NIC (using ethtool or similar).
# Disabling TX checksum offloading is *required* for connecting OS endpoint
# with NIC endpoint.
# You can find more information at https://github.com/luigirizzo/netmap
#
netmap:
# To specify OS endpoint add plus sign at the end (e.g. "ens33+")
- interface: ens33
# Number of capture threads. "auto" uses number of RSS queues on interface.
# Warning: unless the RSS hashing is symmetrical, this will lead to
# accuracy issues.
#threads: auto
# You can use the following variables to activate netmap tap or IPS mode.
# If copy-mode is set to ips or tap, the traffic coming to the current
# interface will be copied to the copy-iface interface. If 'tap' is set, the
# copy is complete. If 'ips' is set, the packet matching a 'drop' action
# will not be copied.
# To specify the OS as the copy-iface (so the OS can route packets, or forward
# to a service running on the same machine) add a plus sign at the end
# (e.g. "copy-iface: ens33+"). Don't forget to set up a symmetrical ens33+ -> ens33
# for return packets. Hardware checksumming must be *off* on the interface if
# using an OS endpoint (e.g. 'ifconfig ens33 -rxcsum -txcsum -rxcsum6 -txcsum6' for FreeBSD
# or 'ethtool -K ens33 tx off rx off' for Linux).
#copy-mode: tap
#copy-iface: ens33
# Set to yes to disable promiscuous mode
# disable-promisc: no
# Choose checksum verification mode for the interface. At the moment
# of the capture, some packets may have an invalid checksum due to
# the checksum computation being offloaded to the network card.
# Possible values are:
# - yes: checksum validation is forced
# - no: checksum validation is disabled
# - auto: Suricata uses a statistical approach to detect when
# checksum off-loading is used.
# Warning: 'checksum-validation' must be set to yes to have any validation
#checksum-checks: auto
# BPF filter to apply to this interface. The pcap filter syntax apply here.
#bpf-filter: port 80 or udp
#- interface: ens33
#threads: auto
#copy-mode: tap
#copy-iface: ens33
# Put default values here
- interface: default
# PF_RING configuration: for use with native PF_RING support
# for more info see http://www.ntop.org/products/pf_ring/
pfring:
- interface: ens33
# Number of receive threads. If set to 'auto' Suricata will first try
# to use CPU (core) count and otherwise RSS queue count.
threads: auto
# Default clusterid. PF_RING will load balance packets based on flow.
# All threads/processes that will participate need to have the same
# clusterid.
cluster-id: 99
# Default PF_RING cluster type. PF_RING can load balance per flow.
# Possible values are cluster_flow or cluster_round_robin.
cluster-type: cluster_flow
# bpf filter for this interface
#bpf-filter: tcp
# If bypass is set then the PF_RING hw bypass is activated, when supported
# by the network interface. Suricata will instruct the interface to bypass
# all future packets for a flow that need to be bypassed.
#bypass: yes
# Choose checksum verification mode for the interface. At the moment
# of the capture, some packets may have an invalid checksum due to
# the checksum computation being offloaded to the network card.
# Possible values are:
# - rxonly: only compute checksum for packets received by network card.
# - yes: checksum validation is forced
# - no: checksum validation is disabled
# - auto: Suricata uses a statistical approach to detect when
# checksum off-loading is used. (default)
# Warning: 'checksum-validation' must be set to yes to have any validation
#checksum-checks: auto
# Second interface
#- interface: ens33
# threads: 3
# cluster-id: 93
# cluster-type: cluster_flow
# Put default values here
- interface: default
#threads: 2
# For FreeBSD ipfw(8) divert(4) support.
# Please make sure you have ipfw_load="YES" and ipdivert_load="YES"
# in /etc/loader.conf or kldload'ing the appropriate kernel modules.
# Additionally, you need to have an ipfw rule for the engine to see
# the packets from ipfw. For Example:
#
# ipfw add 100 divert 8000 ip from any to any
#
# N.B. This example uses "8000" -- this number must mach the values
# you passed on the command line, i.e., -d 8000
#
ipfw:
# Reinject packets at the specified ipfw rule number. This config
# option is the ipfw rule number AT WHICH rule processing continues
# in the ipfw processing system after the engine has finished
# inspecting the packet for acceptance. If no rule number is specified,
# accepted packets are reinjected at the divert rule which they entered
# and IPFW rule processing continues. No check is done to verify
# this will rule makes sense so care must be taken to avoid loops in ipfw.
#
## The following example tells the engine to reinject packets
# back into the ipfw firewall AT rule number 5500:
#
# ipfw-reinjection-rule-number: 5500
napatech:
# When use_all_streams is set to "yes" the initialization code will query
# the Napatech service for all configured streams and listen on all of them.
# When set to "no" the streams config array will be used.
#
# This option necessitates running the appropriate NTPL commands to create
# the desired streams prior to running Suricata.
#use-all-streams: no
# The streams to listen on when auto-config is disabled or when and threading
# cpu-affinity is disabled. This can be either:
# an individual stream (e.g. streams: [0])
# or
# a range of streams (e.g. streams: ["0-3"])
#
streams: ["0-3"]
# Stream stats can be enabled to provide fine grain packet and byte counters
# for each thread/stream that is configured.
#
enable-stream-stats: no
# When auto-config is enabled the streams will be created and assigned
# automatically to the NUMA node where the thread resides. If cpu-affinity
# is enabled in the threading section. Then the streams will be created
# according to the number of worker threads specified in the worker-cpu-set.
# Otherwise, the streams array is used to define the streams.
#
# This option is intended primarily to support legacy configurations.
#
# This option cannot be used simultaneously with either "use-all-streams"
# or "hardware-bypass".
#
auto-config: yes
# Enable hardware level flow bypass.
#
hardware-bypass: yes
# Enable inline operation. When enabled traffic arriving on a given port is
# automatically forwarded out its peer port after analysis by Suricata.
#
inline: no
# Ports indicates which Napatech ports are to be used in auto-config mode.
# these are the port IDs of the ports that will be merged prior to the
# traffic being distributed to the streams.
#
# When hardware-bypass is enabled the ports must be configured as a segment.
# specify the port(s) on which upstream and downstream traffic will arrive.
# This information is necessary for the hardware to properly process flows.
#
# When using a tap configuration one of the ports will receive inbound traffic
# for the network and the other will receive outbound traffic. The two ports on a
# given segment must reside on the same network adapter.
#
# When using a SPAN-port configuration the upstream and downstream traffic
# arrives on a single port. This is configured by setting the two sides of the
# segment to reference the same port. (e.g. 0-0 to configure a SPAN port on
# port 0).
#
# port segments are specified in the form:
# ports: [0-1,2-3,4-5,6-6,7-7]
#
# For legacy systems when hardware-bypass is disabled this can be specified in any
# of the following ways:
#
# a list of individual ports (e.g. ports: [0,1,2,3])
#
# a range of ports (e.g. ports: [0-3])
#
# "all" to indicate that all ports are to be merged together
# (e.g. ports: [all])
#
# This parameter has no effect if auto-config is disabled.
#
ports: [0-1,2-3]
# When auto-config is enabled the hashmode specifies the algorithm for
# determining to which stream a given packet is to be delivered.
# This can be any valid Napatech NTPL hashmode command.
#
# The most common hashmode commands are: hash2tuple, hash2tuplesorted,
# hash5tuple, hash5tuplesorted and roundrobin.
#
# See Napatech NTPL documentation other hashmodes and details on their use.
#
# This parameter has no effect if auto-config is disabled.
#
hashmode: hash5tuplesorted
##
## Configure Suricata to load Suricata-Update managed rules.
##
default-rule-path: /etc/suricata/rules
rule-files:
- http.rules
##
## Auxiliary configuration files.
##
classification-file: /etc/suricata/classification.config
reference-config-file: /etc/suricata/reference.config
threshold-file: /etc/suricata/threshold.config
##
## Include other configs
##
# Includes: Files included here will be handled as if they were in-lined
# in this configuration file. Files with relative pathnames will be
# searched for in the same directory as this configuration file. You may
# use absolute pathnames too.
# You can specify more than 2 configuration files, if needed.
#include: include1.yaml
#include: include2.yaml
- 0 文章数
- 0 关注者