


官方公众号企业安全新浪微博

FreeBuf.COM网络安全行业门户,每日发布专业的安全资讯、技术剖析。

FreeBuf+小程序

XDEBUG调试配置
- 关注
XDEBUG调试配置
XDEBUG调试配置
环境:windows10 、phpstudy8.1、vscode
调试为本地调试
- 在phpstudy中php扩展里勾选xdebug扩展
- 将phpstudy里php.ini中xdebug部分修改为:
[Xdebug]
zend_extension=C:/phpstudy_pro/Extensions/php/php7.3.4nts/ext/php_xdebug.dll
xdebug.collect_params=1
xdebug.collect_return=1
xdebug.auto_trace=Off
xdebug.trace_output_dir=C:/phpstudy_pro/Extensions/php_log/php7.3.4nts.xdebug.trace
xdebug.profiler_enable=Off
xdebug.profiler_output_dir=C:/phpstudy_pro/Extensions/php_log/php7.3.4nts.xdebug.profiler
xdebug.remote_enable=1
xdebug.remote_autostart=1
xdebug.remote_host=localhost
xdebug.remote_port=9003
xdebug.remote_handler=dbgp
- vscode安装PHP Debug插件,并在扩展设置setting.json文件中全覆盖为(php.debug.executablePath值为phpstudy的php路径):
{
    "workbench.colorTheme": "Default High Contrast Light",
    "php.debug.executablePath": "C:\\phpstudy_pro\\Extensions\\php\\php7.3.4nts\\php.exe"
}
- vscode打开phpstudy目录下的项目文件(注意是phpstudy的www目录下代码文件),会提示创建launch.json文件,修改端口为xdebug相同的端口就行(此处默认即可)。此处一般仅需修改端口信息
{
    // 使用 IntelliSense 了解相关属性。
    // 悬停以查看现有属性的描述。
    // 欲了解更多信息,请访问: https://go.microsoft.com/fwlink/?linkid=830387
    "version": "0.2.0",
    "configurations": [
        {
            "name": "Listen for Xdebug",
            "type": "php",
            "request": "launch",
            "port": 9003
        },
        {
            "name": "Launch currently open script",
            "type": "php",
            "request": "launch",
            "program": "${file}",
            "cwd": "${fileDirname}",
            "port": 0,
            "runtimeArgs": [
                "-dxdebug.start_with_request=yes"
            ],
            "env": {
                "XDEBUG_MODE": "debug,develop",
                "XDEBUG_CONFIG": "client_port=${port}"
            }
        },
        {
            "name": "Launch Built-in web server",
            "type": "php",
            "request": "launch",
            "runtimeArgs": [
                "-dxdebug.mode=debug",
                "-dxdebug.start_with_request=yes",
                "-S",
                "localhost:0"
            ],
            "program": "",
            "cwd": "${workspaceRoot}",
            "port": 9003,
            "serverReadyAction": {
                "pattern": "Development Server \\(http://localhost:([0-9]+)\\) started",
                "uriFormat": "http://localhost:%s",
                "action": "openExternally"
            }
        }
    ]
}
- 到这步已经配置好可以使用了。使用先点击“运行和调试”的开始键
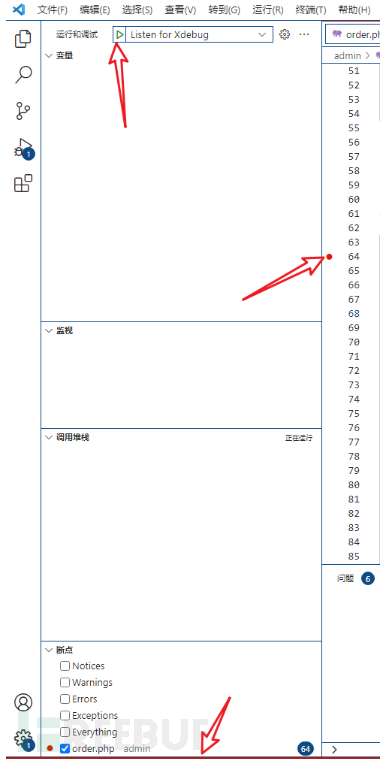
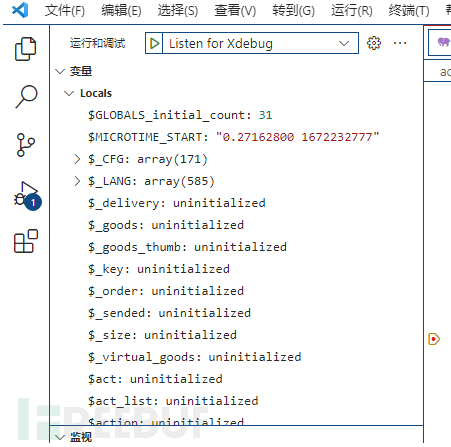
- 浏览器访问对应的功能触发断点,即可看到已经有堆栈信息。 此处浏览应无需浏览器的php debug插件,实测bp的repeater里也可触发断点
本文为 独立观点,未经允许不得转载,授权请联系FreeBuf客服小蜜蜂,微信:freebee2022
被以下专辑收录,发现更多精彩内容
+ 收入我的专辑
+ 加入我的收藏
相关推荐
- 0 文章数
- 0 关注者